← All case studies
Analytics · field-ops
Chicago Telecom Field-Ops
A data-driven optimization of cell-tower maintenance logistics, built on geospatial, time-series, and correlation analysis feeding a Power BI control dashboard.
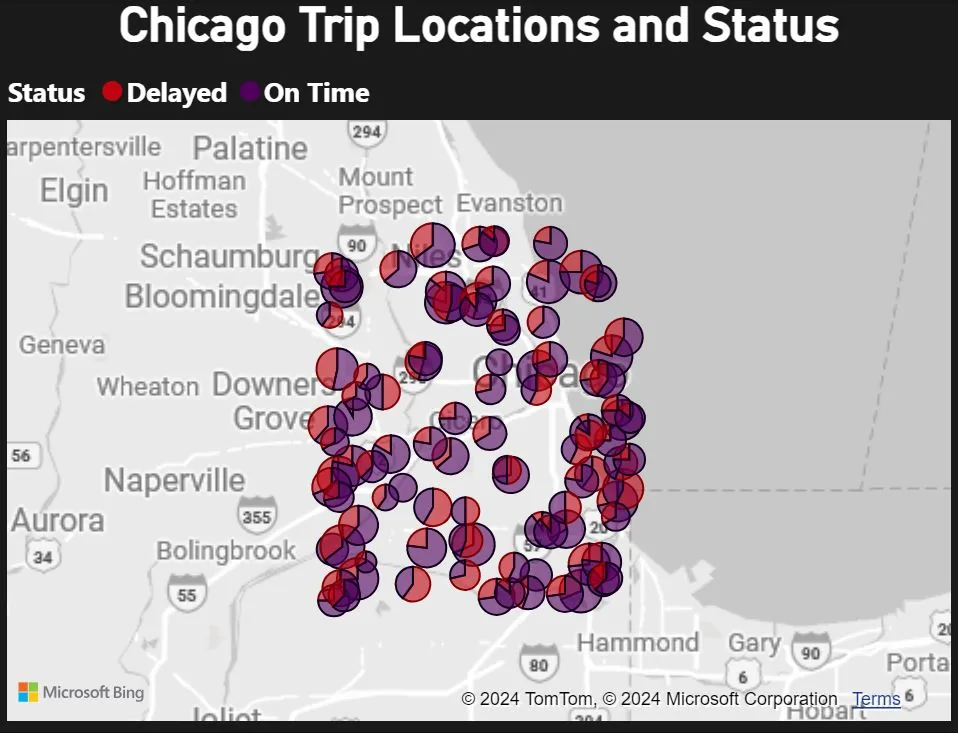
Cell-site locations shown are randomized to protect carrier-confidential site data; all metrics, methods, and results are real.
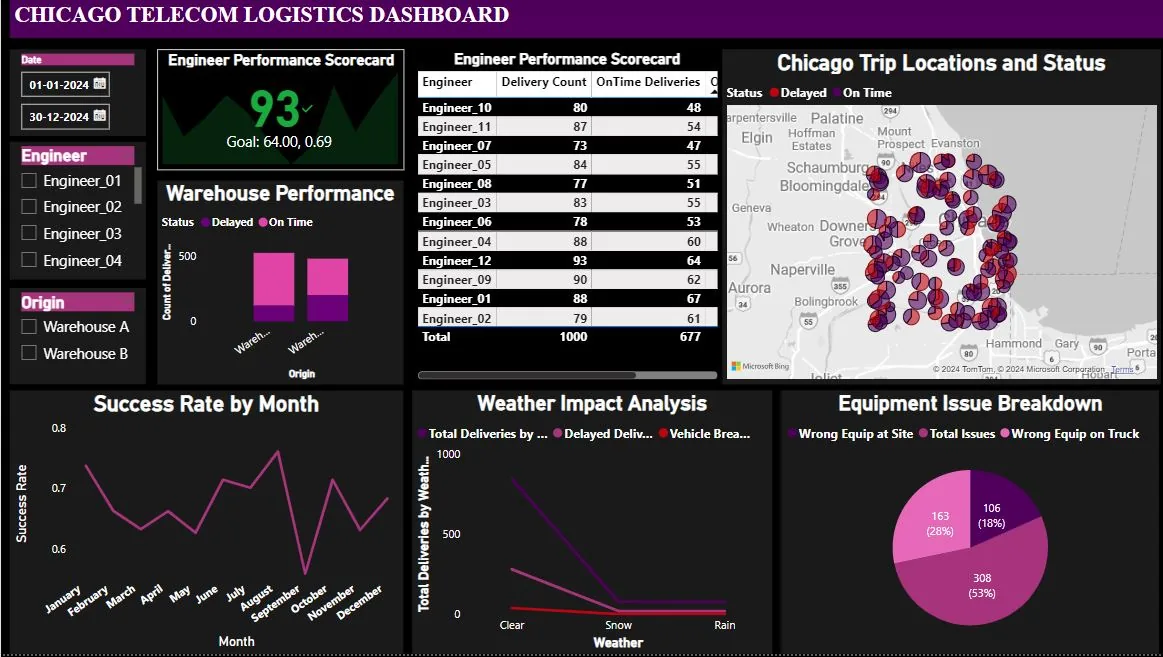
70% → 85%trip success rate
−50%wrong-equipment issues
−20%winter weather delays
−30%downtown security incidents
Problem
Wasted trips, unclear causes
- Delivery delays and wasted maintenance trips with no single view of why.
- Site readiness, vendor and engineer performance all affecting efficiency, unmeasured.
- No real-time monitoring of the metrics that mattered.
Approach
Measure the network, then optimize
- Collected trip-tracking, vehicle GPS, site-readiness logs, equipment inventory, and weather data.
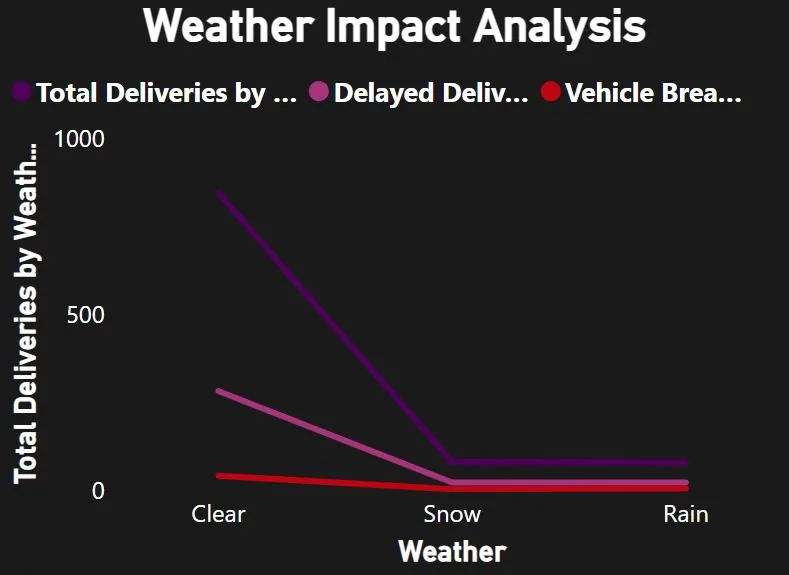
- Geospatial analysis for location patterns; time-series for seasonal trends; correlation of site readiness vs trip success.
- Comparative warehouse and engineer performance analysis.
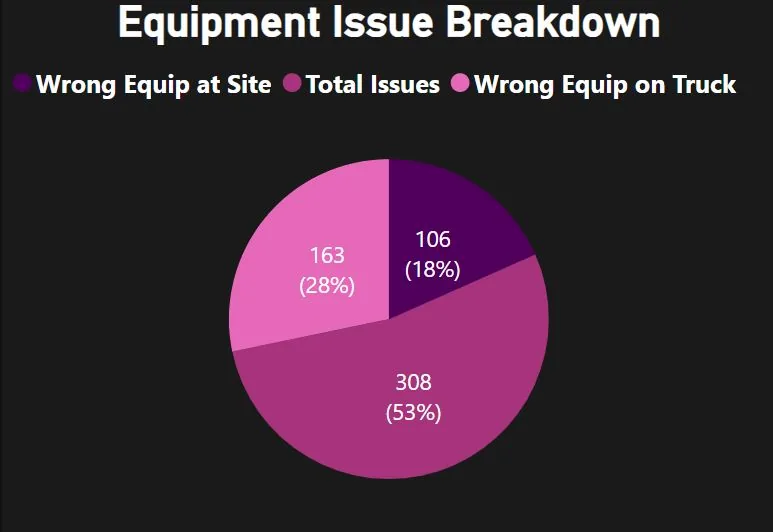
- Built an interactive Power BI dashboard: geospatial trip status, warehouse comparison, engineer scorecards, equipment tracking.
Results
Phased rollout, measured lift
- Overall trip success rate improved from 70% to 85% (15-point lift).
- Wrong-equipment issues from Warehouse A cut 50%.
- Weather-related winter delays down 20%.
- Security incidents in high-risk downtown areas down 30%, over a 6-month phased implementation.

Source: Chicago Telecom logistics deck.